
Summary
Grading OKRs happens at the end of every cycle and is an opportunity and non-biased way to reflect on a team’s overall performance. Discover why grading OKRs is critical to improving your goal-setting skills.
Grading is an unbiased activity, like the final score of a game. For every Key Result, we mark how far we got.
The Andy Grove approach to grading OKRs is a simple “yes” or “no”. It will be very clear if you met or exceeded your Key Result – or if you didn’t.
If you’re using OKR software, OKR scores will be system-generated. If not, calculating the score manually should be simple, because Key Results should be written so the measure is easy to quantify, and any team member should be able to verify the score – without debate.
Some teams use whole numbers to score, others use percentages, and famously, Google uses decimal numbers. Whichever system you use, it’s good to understand the meaning behind the score.
To get an overall score for an OKR, take the average score of its Key Results. Each KR counts equally toward the total OKR score. Each score corresponds to a grade for the OKR, the higher the better.
Here’s an example of scoring an OKR, using Google’s decimal scoring system:
Objective: Increase a car’s fuel economy.
KR1: Reduce the car’s weight by 10 percent.
Our team reduced its weight by 9 percent, so we got a score of 0.9.
KR2: Reduce drag by 12 percent.
We cut it by 6 percent, for a score of 0.5.
KR3: Source more fuel-efficient tires.
Unfortunately, we haven’t closed the deal yet, but we’re about halfway through the process and it should come together soon. So we get a score of 0.5.
To score our overall OKR, we take the average of the three KR scores: In this case = 0.63.
Scoring is that quick and simple.
Grading is a little more nuanced. Just like in some schools 90% is an A and in others 94% is an A, grading can vary from organization to organization.
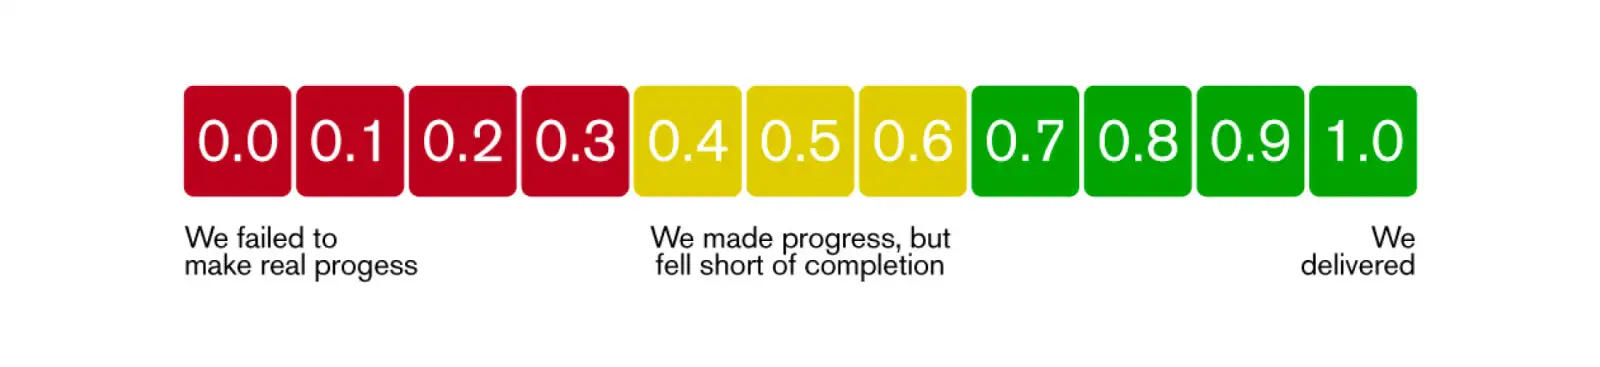
For example, in grading Aspirational OKRs, Google considers a range of:
- 0.7 to 1.0 = green. (We’re on track; the things we’re doing are working.)
- 0.4 to 0.6 = yellow. (We’re at risk; we might need to adjust our approach.)
- 0.0 to 0.3 = red. (We likely won’t meet our KRs. It’s time to take a hard look at what we’re doing and get collective buy-in on how to move forward.)
That grading scale looks like this:
Your organization might decide on a different grading scale, depending on how aggressive or conservative your culture is.
Grading Aspirational vs Committed OKRs
For Aspirational OKRs, there is a spectrum between greatness and failure. In the example shown above, if we use Google’s grading scale, a score of .63 equates to progress, but not total success.
For Committed OKRs, grading is pass/fail and should hit a score of 1.0, or 100 percent. There’s no middle ground for these goals. In the example above, if this were a Committed OKR, 0.63 would be a fail.
To build goal-setting muscle, it’s important to look at the average score across all your Aspirational OKRs. Don’t weigh its success or failure based on a single Aspirational OKR.
With Aspirational OKRs, some scores will miss the mark completely, say 10%. Others may hover around 50%. You might get a green one at 80%, and every once in a while you’ll even overachieve above 100%.
If you’re consistently scoring below 30% across all your aspirational goals, it’s a sign that you’re setting goals that are too ambitious for your current capacity or approach. On the other hand, if you’re consistently scoring 100% or higher on all your Aspirational OKRs – that’s a clear sign of sandbagging – when you pretend a goal is harder to achieve than it really is.
The average score across all your Aspirational OKRs is a proxy for your organization’s appetite for stretch. Google knows if its average is 70%, their teams are making bold enough OKRs. Your organization might set a different bar – just be sure to communicate it clearly across the organization.
Lastly, if your organization is consistently falling short of 100% on Committed OKRs, it’s important to assess why. It might mean that team capacity is too low, or that other priorities are higher but not named, causing lack of alignment. Use these learnings to improve performance in the next cycle.
If your organization’s average score on Committed OKRs is 100% – it’s an indication that the team is ready to stretch. Identify what the team is doing well and decide if you should double down! Then consider setting the bar higher in the next cycle.
OKR Grading: Self-Assessment and Reflection
On their own, grades don’t mean all that much. That’s why we always pair grading with self-assessment and reflection.
Self-assessment adds subjective judgment to your Objective scores.
In analyzing OKR performance, unbiased scores should be looked at subjectively, in case there are extenuating circumstances.
Say you work on a PR team, and one of your quarterly Key Results was to generate new leads by landing three national news placements.
The team landed only two of the three, for an initial grade of 0.67, or 67 percent. But one of them was a front-page mention in The Wall Street Journal. And that led directly to signing two big clients.
During self-assessment, it would be appropriate to bump your score to 90 percent for the KR. In terms of impact, you knocked it out of the park!
Or perhaps your team landed only two placements in smaller publications because you were too late getting press releases out. In your self-assessment, you might lower your score to 30 percent to account for the failure in the process.
After the self-assessment is complete, reflection helps us understand what happened and figure out how to improve things for the next cycle.
Let’s go back to our PR example. With discussion, the team realizes that their main bottleneck was inside their internal process around approvals. With even more digging, they discover they could speed up the process by holding a combined review across the company and reduce approval time by one week.
With reflection, they learned something of significant value to the team, not just for that particular OKR.
Here are some questions to help your team perform better:
- Did we accomplish all of our Objectives?
- If we didn’t, what obstacles did we face?
- If we could rewrite a goal that we achieved in full, what would we change?
- What have we learned that might change our approach in the next OKR cycle?
In general, OKR reflections are about asking the team: “How can we get better?”
If you’ve been tracking your Key Results throughout the cycle, you’ll have a good read on what your scores will be, and there are not going to be many surprises about where you landed. But since people will have differing opinions about why you landed where you did, teamwork is especially important in this subjective phase of the work.
You’ll find the most value in collective reflections, where you’re drawing conclusions together.
Conclusion
Grading OKRs combines unbiased scoring with subjective insights about what the team did well and what they can do better. It helps drive mission-critical priorities, and it’s also a great indicator of a team’s overall performance. By taking time at the end of one cycle to grade and reflect, you set the team up for greater success in the next one. Teams that can consistently deliver on meaningful, aggressive and aspirational OKRs are well on their way to operating excellence.
Have you graded your OKRs recently? We’d love to hear what they were and how they went. Be sure to check out our FAQs, Stories, and Resources, or sign up for our Audacious newsletter.

